

Highlights:
- Second quarter 2019 revenues of $363.6 million, up 1.6% compared to prior year period
- Six month 2019 revenues of $699.0 million, up 1.7% compared to prior year period
- Second quarter 2019 net income of $7.5 million and EBITDA, as adjusted, of $27 million
- Six month 2019 net income of $10.9 million and EBITDA, as adjusted, of $47 million
- Record client assets of $177.7 billion at June 30, 2019, including record advisory assets under management of $85.7 billion
- Recurring revenue of 77.1% for the trailing 12 months ended June 30, 2019 in independent advisory and brokerage services segment
- Shareholders' equity of $246.6 million at June 30, 2019
MIAMI--(BUSINESS WIRE)-- Ladenburg Thalmann Financial Services Inc. (NYSE American: LTS, LTS PrA, LTSL, LTSF, LTSK, LTSH) today announced financial results for the three and six months ended June 30, 2019.
Richard Lampen, Chairman, President and CEO of Ladenburg, said, "We are pleased with our robust second quarter 2019 results, including growth in client assets to a record $177.7 billion and continued strong operating financial performance. Our independent advisory and brokerage firms and capital markets business performed well during the quarter. Our investment banking pipeline is solid, and the increased levels of capital markets activity have continued into the third quarter. Investment banking revenue has rebounded since the temporary U.S. government shutdown during the first quarter. We remain focused on continuing our growth and returning capital to shareholders, as appropriate."
Adam Malamed, Executive Vice President and Chief Operating officer of Ladenburg, said: "We made solid progress on the continued growth of our nationwide network of independent financial advisors during the first half of 2019, reflecting our successful recruiting efforts over the past three years. Our advisory assets under management at June 30, 2019 were a record $85.7 billion, up 14.0% from $75.2 billion at June 30, 2018 and up 17.8% from $72.8 billion at December 31, 2018. As we look ahead to the remainder of 2019, we will continue to invest in opportunities to grow recurring revenues, while continuing to manage expenses through shared services and operational efficiencies. Our ultimate goal is to further drive margin and profitability improvements across the enterprise while making strategic investments to create value for our employees, financial advisors and shareholders."
For the Three and Six Months Ended June 30, 2019 (See Table 1)
Second quarter 2019 revenues were $363.6 million, a 1.6% increase from revenues of $357.8 million in the second quarter of 2018. Commissions revenue for the second quarter of 2019 decreased by 0.3% to $179.8 million from $180.4 million for the comparable period in 2018, primarily due to a decrease in our independent advisory and brokerage segment from decreased mutual funds and variable annuity trailing commissions, partially offset by an increase in our insurance brokerage segment due to the acquisition of certain assets of Kestler Financial Group by Highland. Advisory fee revenue for the three months ended June 30, 2019 increased by 2.7% to $126.0 million from $122.6 million for the comparable period in 2018, primarily due to higher advisory asset balances as a result of improved market conditions. Investment banking revenue for the second quarter of 2019 decreased by 1.6% to $11.5 million from $11.7 million for the comparable period in 2018, due to a decrease in capital raising revenue, partially offset by an increase in strategic advisory services revenue. Service fees revenue for the second quarter of 2019 increased by 17.4% to $32.4 million from $27.6 million for the comparable period, primarily due to increased revenues from our cash sweep programs.
Net income attributable to the Company for the second quarter of 2019 was $7.5 million, as compared to net income attributable to the Company of $9.3 million in the second quarter of 2018, primarily due to a decrease in other income at our corporate segment related to the forgiveness of the NFS loan in May 2018 and increased overall expenses. Net loss available to common shareholders, after payment of preferred dividends, was $1.2 million or ($0.01) per basic and diluted common share for the second quarter of 2019, as compared to net income available to common shareholders of $0.8 million or $0.00 per basic and diluted common share in the comparable 2018 period. The second quarter 2019 results included $2.0 million of income tax expense, $7.4 million of non-cash charges for depreciation, amortization and compensation, $0.1 million of amortization of retention and forgivable loans, $2.9 million of amortization of contract acquisition costs and $5.6 million of interest expense. The second quarter 2018 results included $4.6 million of income tax expense, $7.3 million of non-cash charges for depreciation, amortization and compensation, $0.1 million of amortization of retention and forgivable loans, $2.4 million of amortization of contract acquisition costs and $2.2 million of interest expense.
For the six months ended June 30, 2019, the Company had revenues of $699.0 million, a 1.7% increase from revenues of $687.1 million for the comparable 2018 period. Net income attributable to the Company for the six months ended June 30, 2019 was $10.9 million, as compared to net income attributable to the Company of $14.8 million in the comparable 2018 period. Net loss available to common shareholders, after payment of preferred dividends, was $6.4 million or ($0.04) per basic and diluted common share for the six months ended June 30, 2019, as compared to net loss available to common shareholders of $2.3 million or ($0.01) per basic and diluted common share in the comparable 2018 period. The results for the six months ended June 30, 2019 included $3.4 million of income tax expense, $14.7 million of non-cash charges for depreciation, amortization and compensation, $0.3 million of amortization of retention and forgivable loans, $5.7 million of amortization of contract acquisition costs and $10.6 million of interest expense. The comparable 2018 results included $6.7 million of income tax expense, $14.6 million of non-cash charges for depreciation, amortization and compensation, $0.2 million of amortization of retention and forgivable loans, $4.6 million of amortization of contract acquisition costs and $4.0 million of interest expense.
Recurring Revenues
For the trailing twelve months ended June 30, 2019, recurring revenues, which consist of advisory fees, trailing commissions, cash sweep revenues and certain other fees, represented approximately 77.1% of revenues from the Company's independent advisory and brokerage services segment.
EBITDA, as adjusted (See Table 2)
EBITDA, as adjusted, for the second quarter of 2019 was $26.7 million, an increase of 3.3% from $25.8 million in the comparable 2018 period. Attached hereto as Table 2 is a reconciliation of net income attributable to the Company as reported (see "Non-GAAP Financial Measures" below) to EBITDA, as adjusted. EBITDA, as adjusted, for the six months ended June 30, 2019 was $47.1 million, an increase of 2.4% from $46.0 million for the prior year period. The increase in EBITDA, as adjusted, for the second quarter and the six months of 2019 was primarily attributable to increases in our independent advisory and brokerage services segment as a result of increased revenue from our cash sweep programs.
Client Assets
At June 30, 2019, total client assets under administration were $177.7 billion, a 12.0% increase from $168.0 billion at June 30, 2018. At June 30, 2019, client assets included cash balances of approximately $4.3 billion, including approximately $3.9 billion participating in our cash sweep programs.
Stock Repurchases
In April 2019, our board of directors authorized the repurchase of up to an additional 10,000,000 shares of our common stock from time to time on the open market or in privately negotiated transactions depending on market conditions. From the inception of its stock repurchase program in March 2007 through June 30, 2019, the Company has repurchased 85,797,852 shares of its common stock at a total cost of approximately $208.6 million, including purchases outside its stock repurchase program, representing an average price per share of $2.43. As of August 7, 2019, the Company has the authority to repurchase an additional 10,273,937 shares under its current repurchase plan.
Non-GAAP Financial Measures
Earnings before interest, taxes, depreciation and amortization, or EBITDA, as adjusted for acquisition-related expense, amortization of retention and forgivable loans, amortization of contract acquisition costs, change in fair value of contingent consideration related to acquisitions, non-cash compensation expense, financial advisor recruiting expense and other expense, which includes excise and franchise tax expense, severance costs and compensation expense that may be paid in stock, is a key metric the Company uses in evaluating its financial performance. EBITDA, as adjusted, is considered a non-GAAP financial measure as defined by Regulation G promulgated by the SEC under the Securities Act of 1933, as amended. The Company considers EBITDA, as adjusted, important in evaluating its financial performance on a consistent basis across various periods. Due to the significance of non-cash and non-recurring items, EBITDA, as adjusted, enables the Company's Board of Directors and management to monitor and evaluate the business on a consistent basis. The Company uses EBITDA, as adjusted, as a primary measure, among others, to analyze and evaluate financial and strategic planning decisions regarding future operating investments and potential acquisitions. The Company believes that EBITDA, as adjusted, eliminates items that are not indicative of its core operating performance, such as amortization of retention and forgivable loans, amortization of contract acquisition costs and financial advisor recruiting expenses, or do not involve a cash outlay, such as stock-related compensation, which is expected to remain a key element in our long-term incentive compensation program. EBITDA, as adjusted, should be considered in addition to, rather than as a substitute for, income (loss) before income taxes, net income (loss) and cash flows provided by (used in) operating activities.
About Ladenburg
Ladenburg Thalmann Financial Services Inc. (NYSE American: LTS, LTS PrA, LTSL, LTSF, LTSK, LTSH) is a publicly-traded diversified financial services company based in Miami, Florida. Ladenburg's subsidiaries include industry-leading independent advisory and brokerage (IAB) firms Securities America, Triad Advisors, Securities Service Network, Investacorp, and KMS Financial Services, as well as Premier Trust, Ladenburg Thalmann Asset Management, Highland Capital Brokerage, a leading independent life insurance brokerage company and a full-service annuity processing and marketing company, and Ladenburg Thalmann & Co. Inc., an investment bank which has been a member of the New York Stock Exchange for over 135 years. The Company is committed to investing in the growth of its subsidiaries while respecting and maintaining their individual business identities, cultures, and leadership. For more information, please visit www.ladenburg.com.
This press release includes certain forward-looking statements within the meaning of the Private Securities Litigation Reform Act of 1995, including statements regarding future financial performance, future growth, growth of our independent advisory and brokerage business, growth of our investment banking business, future levels of recurring revenue, future synergies, recruitment of financial advisors, future margins, future investments, future dividends and future repurchases of common stock. These statements are based on management's current expectations or beliefs and are subject to uncertainty and changes in circumstances. Actual results may vary materially from those expressed or implied by the statements herein due to changes in economic, business, competitive and/or regulatory factors, including the SEC's proposed rules and interpretations concerning the standards of conduct for broker dealers and investment advisers when dealing with retail investors, future cash flows, a change in the Company's dividend policy by the Company's Board of Directors (which has the ability in its sole discretion to increase, decrease or eliminate entirely the Company's dividend at any time) and other risks and uncertainties affecting the operation of the Company's business. These risks, uncertainties and contingencies include those set forth in the Company's annual report on Form 10-K for the fiscal year ended December 31, 2018 and other factors detailed from time to time in its other filings with the Securities and Exchange Commission. The information set forth herein should be read in light of such risks. Further, investors should keep in mind that the Company's quarterly revenue and profits can fluctuate materially depending on many factors, including the number, size and timing of completed offerings and other transactions. Accordingly, the Company's revenue and profits in any particular quarter may not be indicative of future results. The Company is under no obligation to, and expressly disclaims any obligation to, update or alter its forward-looking statements, whether as a result of new information, future events, changes in assumptions or otherwise, except as required by law.
TABLE 1
LADENBURG THALMANN FINANCIAL SERVICES INC.
CONSOLIDATED STATEMENTS OF OPERATIONS
(Amounts in thousands, except share and per share amounts)
(Unaudited)
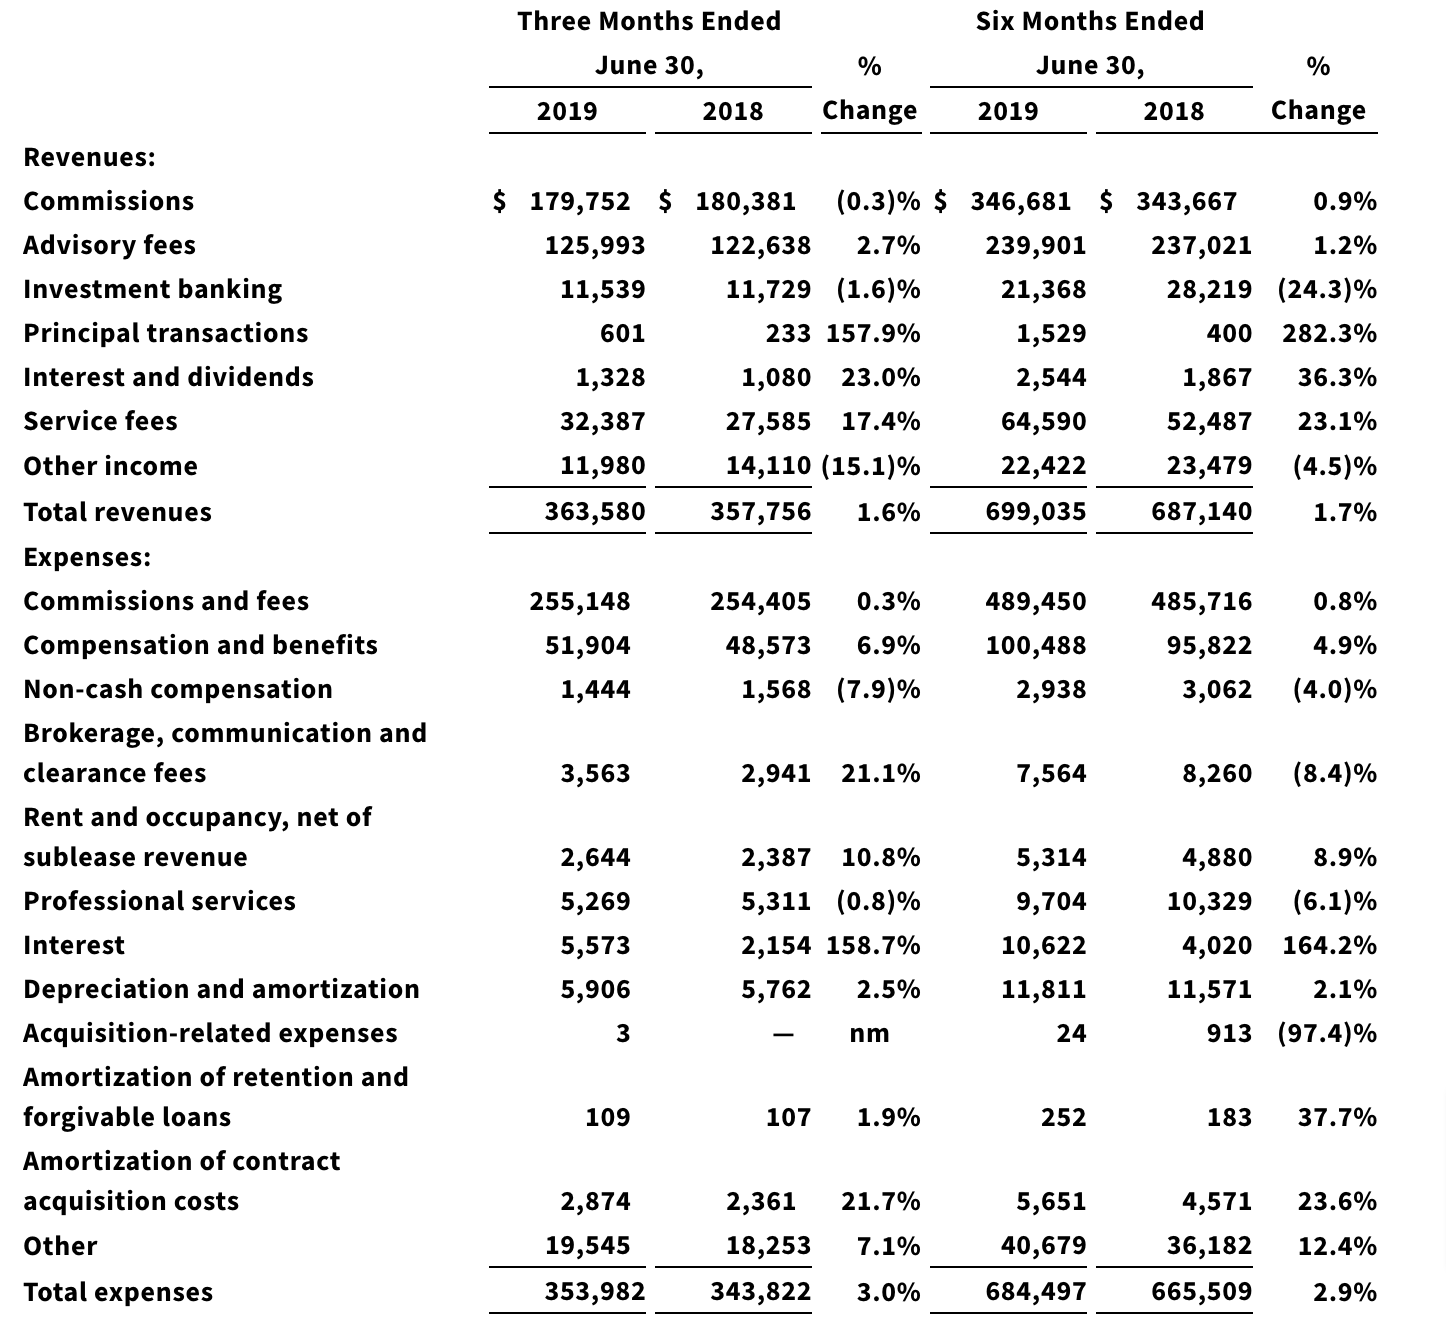
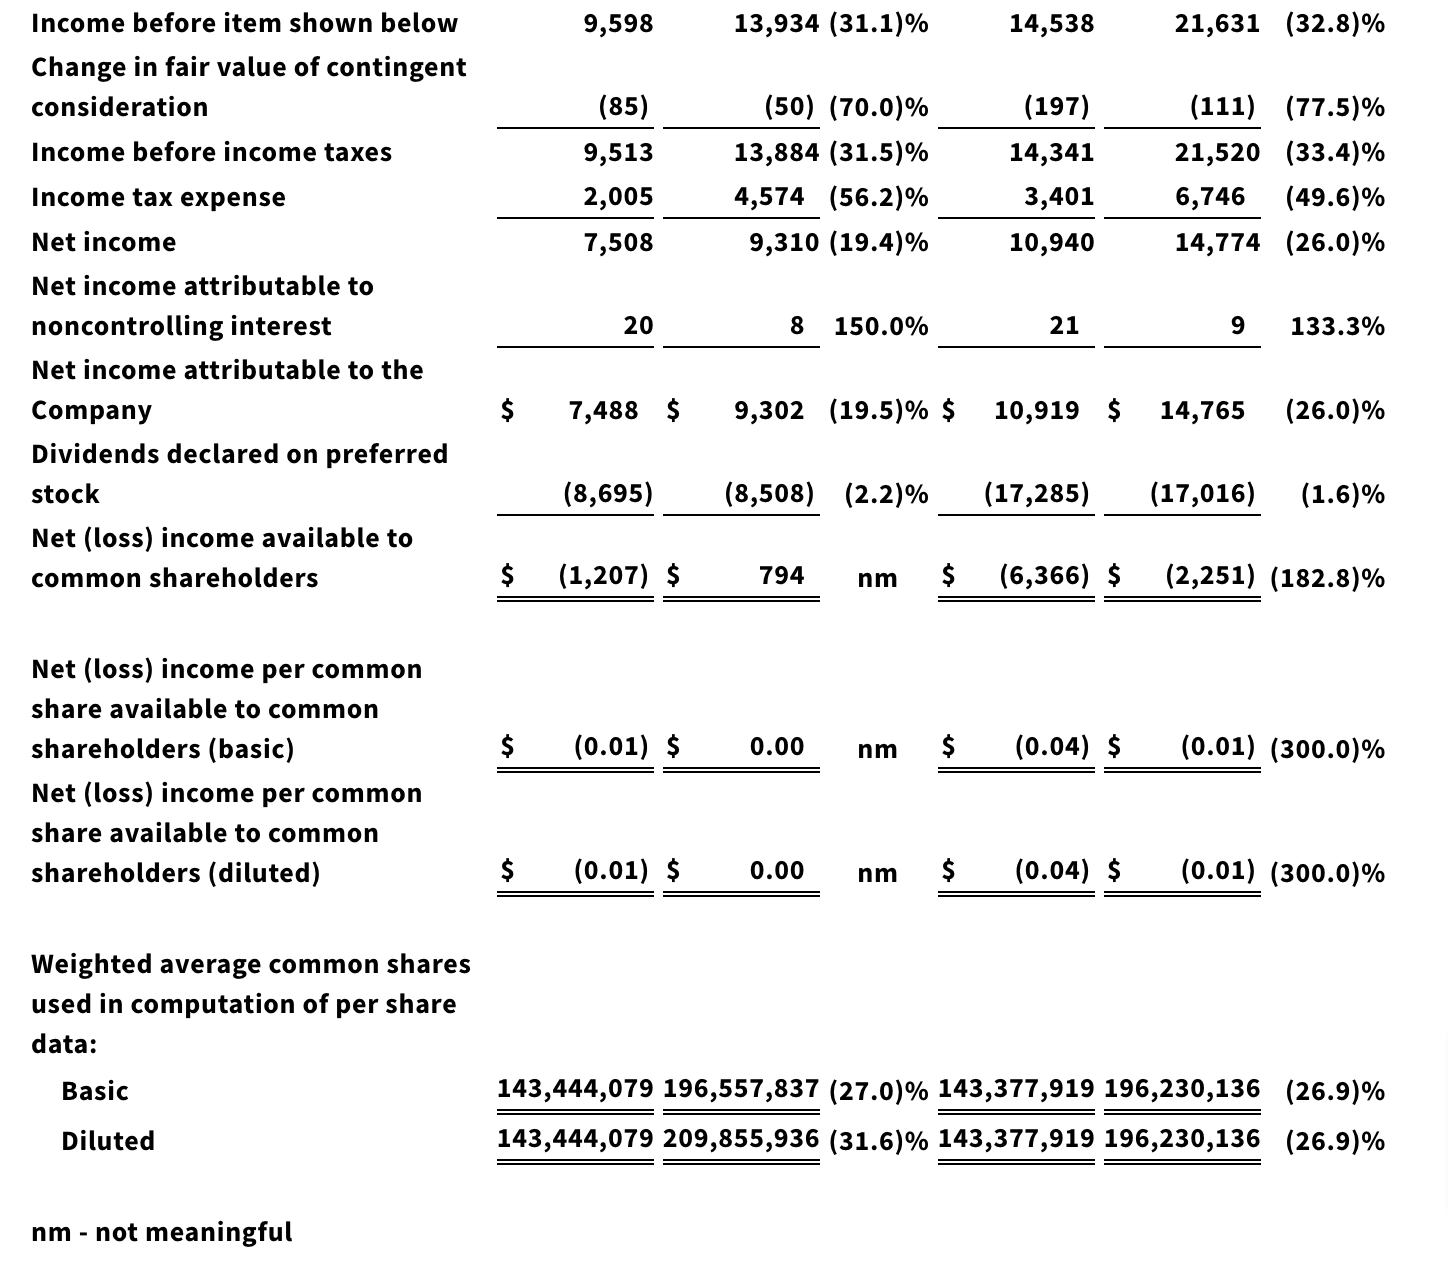
TABLE 2
LADENBURG THALMANN FINANCIAL SERVICES INC.
The following table presents a reconciliation of net income attributable to the Company as reported to EBITDA, as adjusted for the three and six months ending June 30, 2019 and 2018:
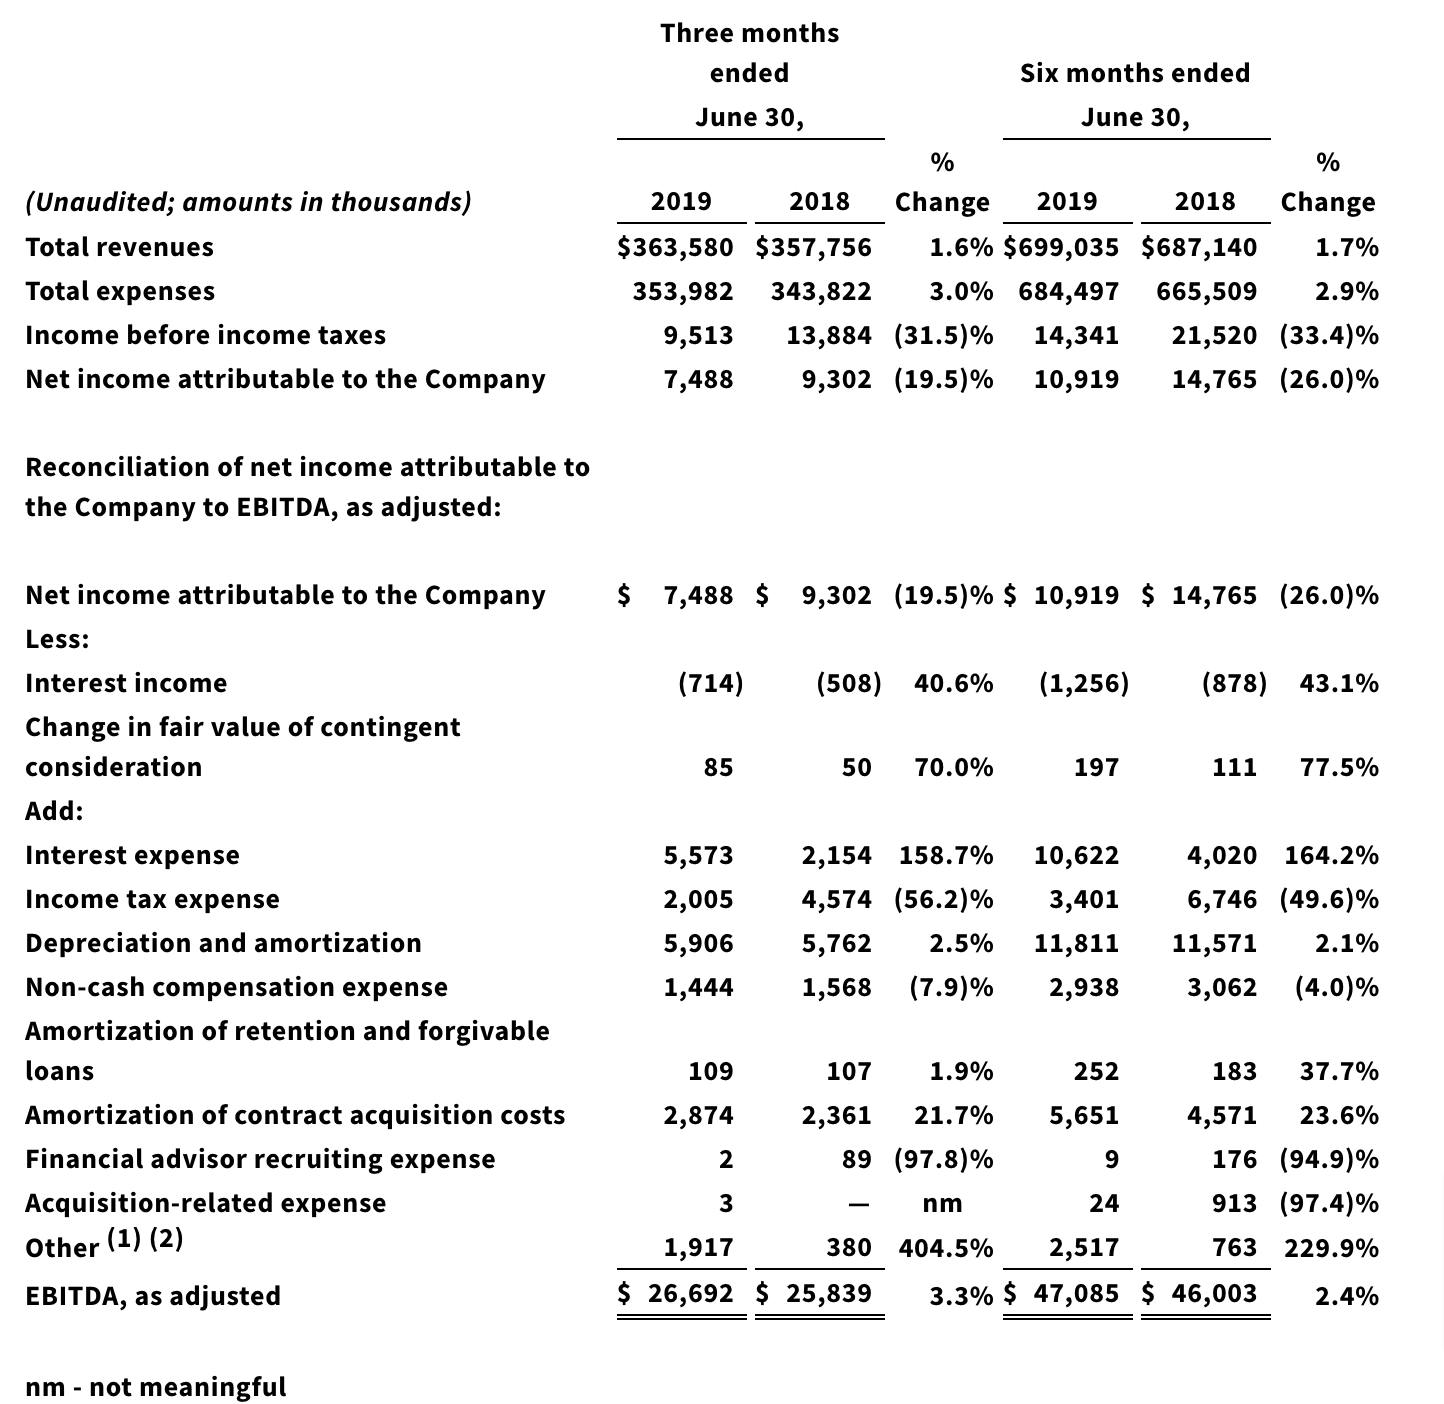
1
Includes severance costs of $1,099 and $1,109, excise and franchise tax expense of $134 and $282, compensation expense that may be paid in stock of $703 and $857 and non-recurring expenses related to a block repurchase of our common stock and other legal matters of ($19) and $269 for the three and six months ended June 30, 2019.
2
Includes severance costs of $86 and $174, excise and franchise tax expense of $169 and $322 and compensation expense that may be paid in stock of $125 and $267 for the three and six months ended June 30, 2018.
View source version on businesswire.com: https://www.businesswire.com/news/home/20190808005153/en/
Emily Claffey / Benjamin Spicehandler
Sard Verbinnen & Co
212-687-8080
Source: Ladenburg Thalmann Financial Services Inc.